- Offering Price: S$ 0.80
- Offering Units: 244.438 million
- Indicative Dividend Yield: 6.3% for 2021; 6.5% for 2022
- NAV per Unit: S$ 0.76
- P/NAV: 1.05
- Shares Outstanding: 675 million
- Market Cap: S$ 540 million
- Dividend Policy: Semi-Annually; Distribution would be 100% of distributable income from listing date to end 2022. Thereafter, would be at least 90% of distributable income.

- Sponsor: Daiwa House Industry Co., Ltd.
- Sponsor Shareholding: 10% or 14% subjected to whether over-allotment is exercised.
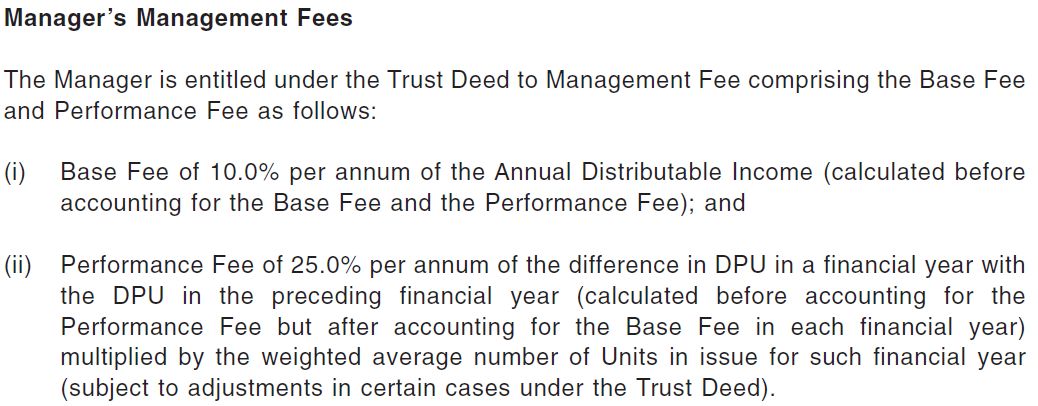
- Manager Shareholding: No Info, however, the manager has elected to receive 50.0% of the Base Fee and Performance Fee (if any) in the form of Units for 2021 and 2022.
- Directors of REIT Manager Shareholding: No Info

Lease Profile
- Number of Properties: 14 Units
- AUM: S$ 1.07 billion (include right-of-use asset)
- Occupancy: 96.3%
- Income in SGD/Major Currencies: 100%
- WALE by NLA: 7.2 years
- Highest Lease Expiry in Single Year by NLA: 46.9% falls in 2026 and onwards, without breakdown
- Weighted Average Land Lease Expiry by NLA: 67.94 years
Debt Profile
- Gearing Ratio (based on purchase consideration): 43.8% ; 47.5% including perps
- Gearing Ratio after Refund of Consumption Tax by 2Q 2022 (based on purchase consideration): 36.9%; 40% including perps
- Cost of Debt: 1.14%
- Fixed Rate Debt %: 100%
- Unsecured Debt %: 0% (assume consumption tax loan is secured loan)
- WADM: 3.6 years (assume JPY 29.0 billion loan from facilities lenders is evenly spread between 3 tranches)
- Highest Debt Maturity in Single Year: 30% falls in 2026 (assume JPY 29.0 billion loan from facilities lenders is evenly spread between 3 tranches)
- Interest Coverage Ratio: 9.3 for 2021, 10.3 for 2022
- Perps over (Debt + Perps) %: 7.8%
Diversification Profile
- Top Sector Contribution by NLA: 79% of Logistics Trade
- Top Geographical Contribution by NPI: 48.9% for 2021, 47.6% for 2022
- Top Property Contribution by NPI: 28.4% for 2021, 27% for 2022
- Top 5 Properties Contribution by NPI: 63.6% for 2021; 62.5% for 2022
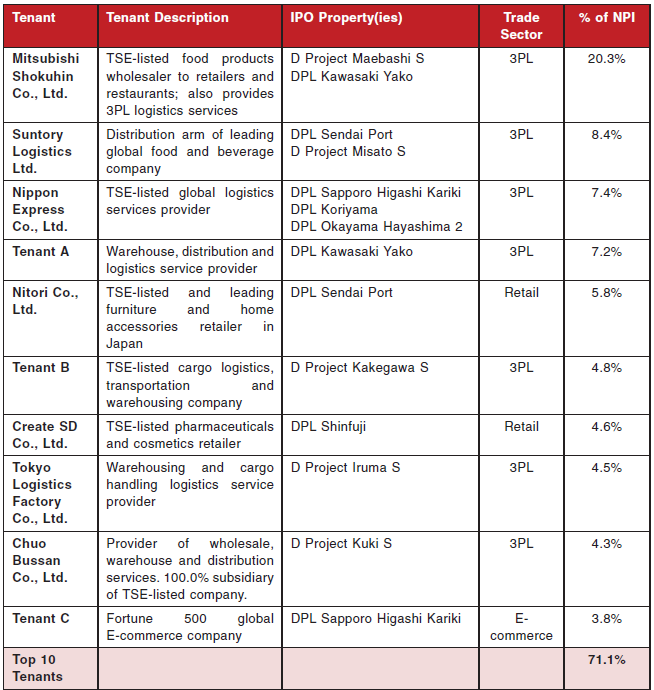
- Top Tenant Contribution by NPI: 20.3%
- Top 10 TenantS Contribution by NPI: 71.1%
Key Financial Metrics
- Property Yield (based on purchase consideration): 4.9%
- Management Fees over Distribution: 10% (base fee)
- Distribution on Capital: 3.5% for 2021; 3.6% for 2022
- Distribution Margin: 50.3% for 2021; 52.2% for 2022
Author's Opinion
| Favorable | Less Favorable |
|---|---|
| Diversified Sector | Low REIT Sponsor's Shareholding |
| Long WALE | 0% Unsecured Debt |
| Low Cost of Debt | High Top Property Contribution |
| 100% Fixed Rate Debt | High Top Tenant & Top 10 Tenants Contributions |
| Long WADM | |
| High Interest Coverage Ratio | |
| Low Top Geographical Contribution | |
| Competitive Management Fees |
Join REIT-TIREMENT Patreon for patron-exclusive posts that cover REITs valuation and more detail on fundamental analysis. You could also refer below for more information:
SREITs Dashboard - Detailed information on individual Singapore REIT
SREITs Data - Overview and Detail of Singapore REIT
REIT Analysis - List of previous REIT analysis posts
REIT-TIREMENT Telegram Channel - Join to receive updates on new post
REIT-TIREMENT Facebook Page - Support by liking my Facebook Page
REIT Investing Community - Facebook Group where members share and discuss REIT topic
*Disclaimer: Materials in this blog are based on my research and opinion which I don't guarantee accuracy, completeness, and reliability. It should not be taken as financial advice or a statement of fact. I shall not be held liable for errors, omissions and loss or damage as a result of the use of the material in this blog. Under no circumstances does the information presented on this blog represent a buy, sell, or hold recommendation on any security, please always do your own due diligence before any decision is made.


No comments:
Post a Comment